

Key Takeaways:
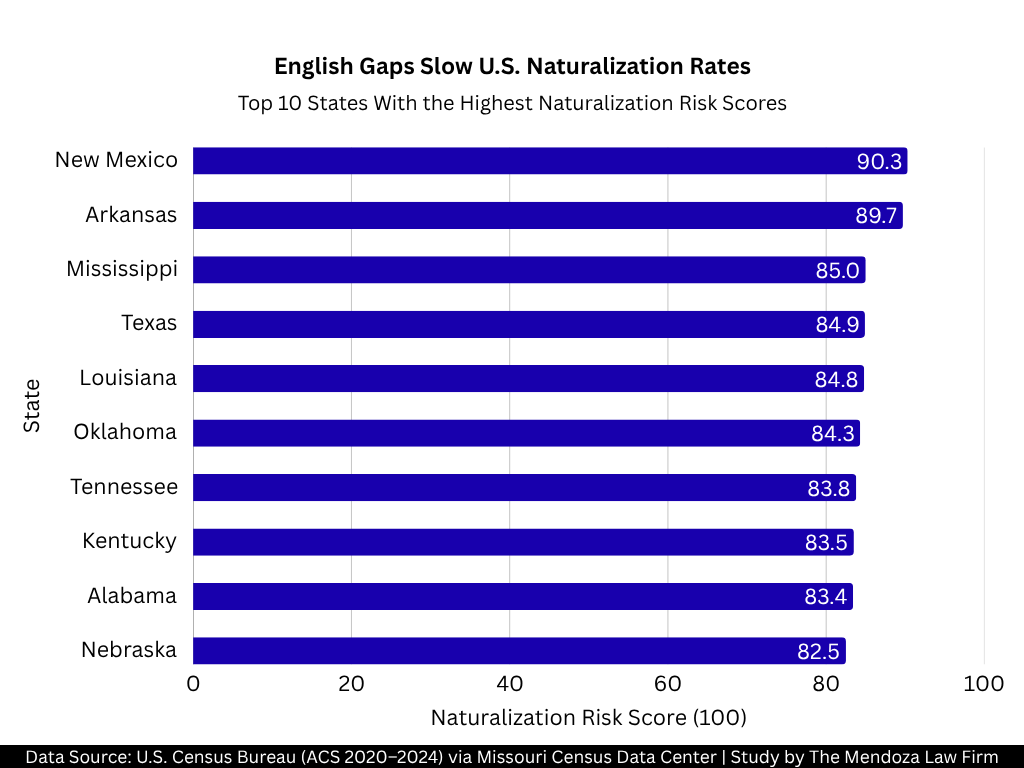
- New Mexico leads all 50 states with a Naturalization Risk Score of 90.3, where 90.42% of foreign-born residents speak English less than “very well.” Arkansas follows at 89.7, recording the highest non-citizen rate nationally at 65.68%.
- Eight of the 10 highest-scoring states are in the South, where the regional average of 77.9 exceeds the national average of 71.8 by over 6 points.
- Vermont ranks last at 47.0 with the nation’s lowest non-citizen rate (35.95%) and lowest limited English proficiency rate (26.25%), followed by New Hampshire at 53.8.
The promise of American citizenship has long drawn people from every corner of the world, yet the path to naturalization is far from uniform. In some parts of the country, foreign-born residents settle into communities where English is widely spoken, and civic integration comes more naturally. In others, they arrive in places where language isolation runs deep and legal status remains unresolved for years. These disparities are not random; they follow clear geographic lines that divide the nation into starkly different realities for those seeking to call themselves American.
This analysis was conducted by The Mendoza Law Firm using U.S. Census Bureau data (2020 to 2024 averages) for all 50 states. Each state was scored on a Naturalization Risk Score from 0 to 100, weighted 70% toward the share of foreign-born residents who are non-citizens and 30% toward the share with limited English proficiency.
States Where Foreign-Born Residents Face the Greatest Naturalization Barriers
Table 1: Top 10 States With the Highest Naturalization Risk Scores
| Rank | U.S. State | Naturalization Risk Score (100) | % of Non-Citizen Population | % of Foreign-Born Population Lacking English Proficiency |
| 1 | New Mexico | 90.3 | 56.54% | 90.42% |
| 2 | Arkansas | 89.7 | 65.68% | 59.25% |
| 3 | Mississippi | 85.0 | 59.33% | 65.63% |
| 4 | Texas | 84.9 | 58.10% | 69.15% |
| 5 | Louisiana | 84.8 | 59.66% | 63.95% |
| 6 | Oklahoma | 84.3 | 59.61% | 62.49% |
| 7 | Tennessee | 83.8 | 60.84% | 57.06% |
| 8 | Kentucky | 83.5 | 59.69% | 59.97% |
| 9 | Alabama | 83.4 | 60.62% | 56.57% |
| 10 | Nebraska | 82.5 | 57.69% | 63.25% |
New Mexico (90.3) and Arkansas (89.7) score well above the rest, but for different reasons: New Mexico is driven by language barriers at 90.42%, while Arkansas leads the country in its non-citizen rate at 65.68%.
States With the Highest Share of Non-Citizens Among Foreign-Born Residents
Table 2: Top 10 States by Non-Citizen Rate
| Rank | U.S. State | % of Non-Citizen Population | Average Annual Non-Citizen Population 2020-2024 | Average Annual Foreign-Born Population 2020-2024 |
| 1 | Arkansas | 65.68% | 108,856 | 165,740 |
| 2 | Tennessee | 60.84% | 262,532 | 431,545 |
| 3 | Alabama | 60.62% | 123,399 | 203,578 |
| 4 | Kentucky | 59.69% | 126,070 | 211,210 |
| 5 | Louisiana | 59.66% | 133,968 | 224,537 |
| 6 | Oklahoma | 59.61% | 152,741 | 256,215 |
| 7 | Mississippi | 59.33% | 42,670 | 71,918 |
| 8 | Indiana | 58.85% | 253,803 | 431,255 |
| 9 | North Dakota | 58.62% | 21,668 | 36,962 |
| 10 | Texas | 58.10% | 3,080,983 | 5,302,466 |
Arkansas tops the list at 65.68%, meaning nearly two in three foreign-born residents in the state have not obtained citizenship, almost 15 points above the national average of 50.61%.
States With the Highest Language Barriers Among Foreign-Born Residents
Table 3: Top 10 States by Limited English Proficiency Rate
| Rank | U.S. State | % of Foreign-Born Population Lacking English Proficiency | Average Annual Limited English Population 2020-2024 | Average Annual Foreign-Born Population 2020-2024 |
| 1 | New Mexico | 90.42% | 180,595 | 199,738 |
| 2 | Texas | 69.15% | 3,666,736 | 5,302,466 |
| 3 | Mississippi | 65.63% | 47,202 | 71,918 |
| 4 | Louisiana | 63.95% | 143,594 | 224,537 |
| 5 | Nebraska | 63.25% | 100,626 | 159,084 |
| 6 | Oklahoma | 62.49% | 160,099 | 256,215 |
| 7 | California | 61.32% | 6,499,255 | 10,598,301 |
| 8 | Kansas | 61.09% | 132,444 | 216,817 |
| 9 | Pennsylvania | 60.38% | 606,806 | 1,004,975 |
| 10 | Iowa | 60.04% | 114,069 | 189,988 |
New Mexico’s rate of 90.42% is an extreme outlier, exceeding second-ranked Texas (69.15%) by over 21 percentage points. California ranks seventh at 61.32%, but its 6.5 million affected residents represent the largest language-barrier population of any state in absolute numbers.
States Where Foreign-Born Residents Face the Fewest Naturalization Barriers
Table 4: Bottom 10 States With the Lowest Naturalization Risk Scores
| Rank | U.S. State | Naturalization Risk Score (100) | % of Non-Citizen Population | % of Foreign-Born Population Lacking English Proficiency |
| 41 | Michigan | 62.3 | 43.41% | 48.37% |
| 42 | Montana | 62.2 | 46.35% | 38.67% |
| 43 | New York | 61.8 | 40.48% | 56.35% |
| 44 | Virginia | 61.1 | 43.37% | 44.72% |
| 45 | Minnesota | 60.6 | 41.10% | 50.71% |
| 46 | West Virginia | 60.6 | 45.44% | 36.61% |
| 47 | Hawaii | 60.4 | 39.21% | 55.96% |
| 48 | Alaska | 57.6 | 38.16% | 51.00% |
| 49 | New Hampshire | 53.8 | 39.14% | 36.42% |
| 50 | Vermont | 47.0 | 35.95% | 26.25% |
Vermont (47.0) holds the lowest score by nearly 7 points over New Hampshire (53.8), recording the nation’s lowest rates in both non-citizen share (35.95%) and limited English proficiency (26.25%). Unlike the Southern-heavy top 10, the bottom 10 spans all four U.S. regions.
Methodology
This analysis used U.S. Census Bureau data accessed through the Missouri Census Data Center, covering average annual estimates from the American Community Survey for the 2020 to 2024 period across all 50 U.S. states. Three variables were collected for each state: average annual foreign-born population, average annual non-citizen population, and average annual foreign-born population that speaks English less than “very well.” Two percentages were derived: the non-citizen rate (non-citizen population divided by foreign-born population, multiplied by 100) and the limited English proficiency rate (limited English population divided by foreign-born population, multiplied by 100). Each percentage was then normalized relative to the highest value observed across all 50 states, with the non-citizen component scaled to a maximum of 70 points and the limited English component scaled to a maximum of 30 points. The Naturalization Risk Score is the sum of these two normalized components, yielding a composite index on a 0 to 100 scale.