

When you look at your weather forecast app, you might take for granted the complexity that lies beneath the simple icon of a sun or a cloud. In reality, that simple icon is the result of a hidden world of science and data that’s more dynamic than you might think. Below, Arnaud Monges, Meteorologist at PredictWind, shares his journey chasing the wind, alongside insights into how to read the sky for safer boating.
From Windsurfer to Meteorologist
Arnaud’s fascination with the weather began 30 years ago, not in a lab, but as a windsurfer in the South of France. Back then, forecasting wind was an intuitive art. With no internet, finding accurate marine weather was a challenge; national TV reports focused on land, and the best available data came from calling a telephone hotline that delivered recorded, hourly wind measurements for specific spots. He had to rely on local knowledge and his senses to decide if it was worth the drive and what sail size to gear.
This eventually led him to a master’s degree in Atmospheric Sciences, and even a measurement campaign in the Amazon forest, where launching weather balloons and climbing observation towers solidified his passion for understanding the atmosphere. Later, Arnaud spent time as an America’s Cup Team Meteorologist, before joining leading high-tech marine weather forecaster, PredictWind.
The Science Behind the Forecast
The weather forecast you see on your phone isn’t magic; it’s a visible manifestation of complex atmospheric physics. Clouds, far from being random formations, are a key visual indicator of what the atmosphere is doing. They are a sign that air is rising, expanding, and cooling, causing water vapor to condense into visible droplets. Clouds are classified by height — from high “Cirro” clouds (above 6,000 meters), middle “Alto” (2,000 to 6,000 meters), to low clouds (under 2,000 meters) — and by shape.
There are two major shapes:
- Stratus: A uniform layer resembling a cover or sheet, with no distinct individual clouds. It’s difficult or impossible to count them, as they blend seamlessly. The layer spans a wide area, completely obscuring the sky behind it.
- Cumulus: Each cloud has a well-defined shape and is clearly separated from the others. These clouds have noticeable thickness, and it’s easy to count them individually. They are spaced apart with visible gaps of clear sky in between.
This process is most often caused by three key mechanisms: convection from the heating of the Earth’s surface, topography forcing wind up and over mountains, or the interaction of warm and cold air masses.
Reading the Sky for Safer Sailing
While modern technology has revolutionized forecasting, for those on the water, there’s no substitute for being able to read the clouds. Knowing what to look for can make a huge difference, particularly in the short term. Sailors should prioritize looking at low-level clouds, as they are closest to the surface and have the most direct influence on surface winds in the next few hours.
Here’s what to look for:
“Sucking” Clouds: A puffy, non-precipitating cumulus cloud can have an updraft that sucks air in from the surface, causing the wind to decrease slightly as the cloud approaches.

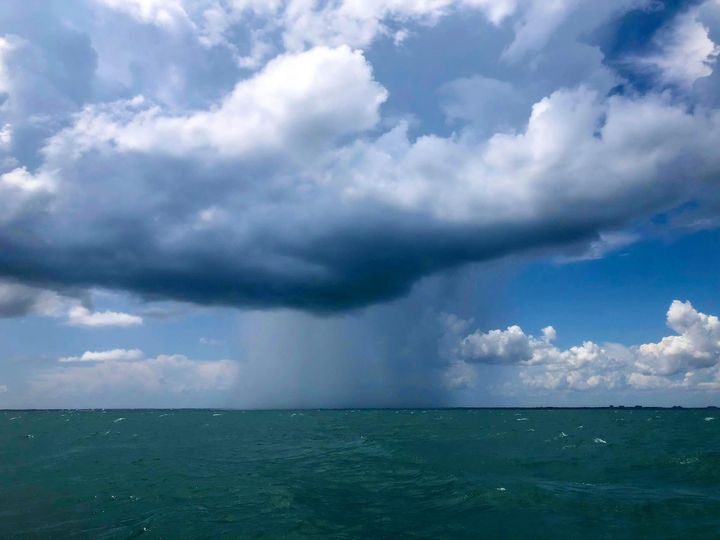
“Blowing” Clouds: A precipitating nimbostratus cloud pushes air outward in a downdraft, creating stronger surface winds. The stronger the rain, the stronger the wind.
Cumulonimbus “Sucking & Blowing” Clouds: The most complex is the cumulonimbus, or thunderstorm, which has both updrafts and downdrafts, leading to sudden and significant changes in wind speed and direction. A critical sign of an extreme weather event heading your way is a shelf cloud, often associated with a squall line. The main threat to a boat is the sudden, strong wind gusts that come with it. You must watch for the gust front – the most dangerous zone for sailors.

From Science to Actionable Insight
This is where the role of modern technology comes in. While the physics and knowing what to look for are important, weather apps like PredictWind translate these core principles into tools that provide users with critical information to make more informed decisions. PredictWind utilizes high-resolution regional models that offer detailed 1km resolution maps of rain and convective cells. It also incorporates data on CAPE (Convective Available Potential Energy) to measure atmospheric instability and predict the potential for thunderstorms. The systems provide clear warnings and are supported by the Global Maritime Distress and Safety System (GMDSS), which gives users marine forecasts from trained meteorologists in a user-friendly graphical format. When forecasts are no longer sufficient, PredictWind’s live rain radar and observations can be used to track developing storms in real-time.
PredictWind’s User-Friendly Approach
PredictWind aims to simplify complex weather data for sailors, making it easy to understand and use for informed decision-making on the water. User-friendly tools like the Daily Briefing, Forecast Tables, and Weather Routing Maps present complex data in an easy-to-understand format. Extreme Weather Warnings highlight potential hazards, while educational resources empower users to interpret forecasts confidently. PredictWind’s help center also offers tutorials and over a hundred articles that break down meteorology science for everyone.
Understanding the atmosphere is complex, but the more we learn, the safer we can make our time on the water. By making the data from high-resolution models and live observations accessible and intuitive, apps like PredictWind empower people to move beyond simply viewing a forecast and begin to understand the complex, beautiful, and sometimes dangerous systems that are constantly in motion, shaping our world every day.